How Surveys Can Accelerate Audience Development
Jump to a section:
EXECUTIVE SUMMARY | SURVEY AS A TOOL | SET UP | DESIGN | ANALYSIS | NEXT STEPS | CONCLUSION | ACKNOWLEDGMENTS
Executive Summary
Nonprofit news organizations have a mission to serve communities, and it is critical they understand who they are reaching and the impact. A well-designed survey is one of the most effective ways for news leaders to understand audience interests, motivations, behaviors and composition so they can make informed editorial and operational decisions that ultimately grow and broaden their audience.
INN has designed a list of nearly 100 tried and tested survey questions your organization can choose from to build a better, or your first, annual reader survey. INN worked with leaders across the network to write questions that are immediately actionable for a nonprofit news organization and collaborated with news audience researchers at universities across the world to ensure questions are methodologically sound and backed by the latest research.
Questions are already ordered and clearly marked, so you can be confident you’re not missing any essential questions. The questions are available as a downloadable list and as a Google Form that allows you to directly import it into your survey software of choice, including SurveyMonkey, Qualtrics and a host of others.
This guide walks you through each step of the survey process and includes a wealth of advice and tips from those with deep experience in audience research on how to use the process to spur action. The main skill required of you to be successful is curiosity about your audience.
A survey can be an incredible asset. It can articulate the desires of the community. It can allow leaders to be proactive with the board and funders in shaping the measures of success year-to-year. It can motivate staff that otherwise don’t see how their work impacts communities or the organization. Ultimately, it’s one of the clearest views into the bonds the organization has with its most dedicated constituencies.
INN’s audience team created these resources and is available to help or provide extra capacity at every step of the survey process based on your organization’s needs. The INN audience team is Sam Cholke, manager of distribution and audience growth, and Allison Altshule, audience research fellow. Reach out to get help with your survey project or talk about how else INN can help with audience development.
Survey as a Tool
There are lots of audience research tools. Google Analytics and other clickstream metrics provide valuable numbers about discrete actions people are taking but tell you little about the motivations driving those actions. Focus groups and case studies can help collect qualitative information from smaller sample sizes about how and why individuals use news reporting, but can be time and resource intensive and can require some special skills to perform effectively.*
Surveys are unique in their ability to solicit quantitative data from larger sample sizes and aggregate patterns about attitudes. They are relatively inexpensive to conduct and require more curiosity than special skills to get real value.
GOAL: A survey of the type laid out here is designed to help define the types of constituencies the organization serves and how their needs and attitudes may differ in actionable ways.
Surveys illuminate the constituencies in your audience
A news audience is not a monolith. It is composed of many constituencies. A survey helps differentiate those constituencies and give shape to the relationships each has with the organization. Each of those constituencies will illuminate distinct engagement patterns, product or content preferences or unique information needs.
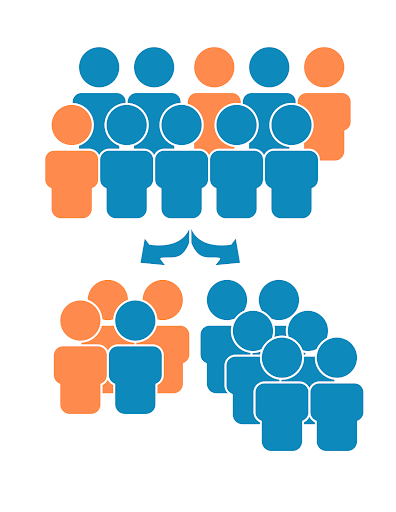
For example, the audience for a news organization reporting on the criminal justice system could include people who work in the industry, those who are personally impacted by incarceration or an activist protesting a planned prison expansion. Each may come to the outlet through different paths, use the reporting in different ways and have a distinct relationship with the news organization.
A survey is NOT a snapshot of your audience
Surveys are excellent at helping you understand how different groups may feel or act but cannot tell you if your audience looks proportionally like the community you hope to serve because of some important limitations.
Surveys only allow you to speak to people who take surveys. The most practical distribution method, email, only allows you to connect with people who prefer to talk over email.
This leads to two common problems when news organizations conduct a survey:
- Older white audiences are more likely to provide their email to a news organization
- Older white audiences are more likely to read email newsletters**
- Older white audiences are more likely to take surveys
So there are several layers of bias, all in the same direction, creating a higher possibility of overrepresentation of one group.
If you’re walking away from your survey saying things like 60% of our audience is women, you’re falling into the trap of bias. You can know what women who took your survey think and how that’s changing over time, but you can’t know from a survey the true proportion of your audience that is women.
All tools have their limitations and it’s important to go into the process thinking about a set of tools that will give you valuable perspectives.
“Last year, we shared the findings of our annual survey with the entire newsroom, and reporters and editors felt discouraged because our audience was represented as mainly older and white. It was so different from what they were expecting. And so we really had to emphasize that this is not a good representation of our audience as a whole. This is who answered the survey. It’s something that needs to be repeated. We can tie some demographic conclusions, maybe, but it’s not going to be a proportion or a percentage.”
— Alejandra Armstrong, Audience Engagement Editor, Cityside
INN staff are available to help design an audience research process that minimizes bias. For more information, contact Sam Cholke, manager of distribution and audience growth, sam@inn.org.
Set Up
This playbook outlines a yearly survey: It is intended to be longer and establish benchmarks that can be revisited year-to-year. Established news organizations may survey much more frequently, including in their welcome email series, after events and many other times. The workflow for an annual survey provides a strong foundation and works for news organizations of all sizes.
The process often starts at an all-department meeting. Representatives from editorial, membership, and revenue teams, for example, may have different data priorities within the survey. Everyone is able to see the questions that we highly encourage to be asked, such as demographics, and is able to select supplementary questions from this template or design their own, saying specifically what action their department will take based on the survey responses.
This process both builds buy-in from all the departments, speeds up the analysis later by surfacing the questions that need to be answered, and clarifies audience research that may need to be done outside the survey. It is also a good time to establish who will be in charge of the design, distribution and analysis and how others can access this data over time.
Suggested Timeline

Design
Careful survey design is key to making a survey useful. It should be easy to take with neutrally framed questions that are clearly connected to important decisions the organization otherwise struggles to make. We are offering a full question set designed in consultation with experts but encourage cutting to the most relevant questions pertaining to your newsroom and personalization.
The first time you set up an annual survey will be the longest process because you’re deciding on questions that will serve as benchmarks and track changes year-to-year.
An annual survey should take about 10-15 minutes for a respondent to complete. That is often about 40 questions, each limited to seven or fewer answer options. Don’t waste time or space asking questions you already know the answer to. It is not necessary to tell people how long it takes to complete the survey.
It’s critical to get other staff involved in picking questions, but remember that the longer a survey is, the less likely your audience will be to complete it. Only include questions that serve a certain purpose and you are certain someone will read all the responses.
Limit yourself to three or fewer open-ended questions. The time it takes to clean, code and synthesize text-based data is usually too cumbersome for many news outlets. You should also only include those questions where someone on staff will take a specific action based on the responses.
There are some basic questions INN experts and researchers recommend be included in most general surveys, which are clearly marked in the full question set. But all questions can be grouped into some general categories.
INN’s template survey generally provides five types of questions:
1. Identity: What parts of a person’s identity are most active when engaging with your organization? Demographics are essential but not often the most important factor. A person’s role in an industry, whether they are a parent or whether they are a homeowner may all be strong identities for people. A story about raising property taxes to build a new school may be engaging on multiple levels. It’s helpful to draw out as many of those relevant parts of a person’s life as possible. Some general identity guidelines:
- Put identity questions at the end. Lead with the hardest questions and keep the easy ones for the end.
- Include an “Other,” or “Prefer not to say” option. Require a response but don’t require people to disclose.
- Localize the options. For example, take the time to learn the five most popular languages in your area rather than making someone read a list of 20 options.
- Format to existing data. Know going in if you’re going to consult or compare your data with the U.S. Census, Pew or other data, and format your options to match.
“When you look at just demographics, the newsletter audience is older and male and white. That’s not an exciting story to tell funders. When we dug in more deeply, it obscures the people in that demographic. Using Department of Labor data, we saw policy nonprofit readers and those employed in the energy sector are more diverse and reflective of those industries. We isolate how those groups use and access the stories, and build from there.”
— Ken Paulman, director, Energy News Network
2. Habits and Actions: These questions help us understand what people’s routines look like and how the organization can best fit into their lives. It’s also a glimpse into how the news may connect to the actions they take in their lives.
- Look to the past. People are relatively good at recalling actions they take routinely and often — less good at predicting what they will do in realistic ways, usually speaking in aspirational terms.
- Find ingrained habits. Do people already do the actions you hope they will also do with your organization, like donate to nonprofits or attend events?
- Ask about community actions. Ask about actions that your organization wants to report out about how people engage in their community — do they shop locally, vote, or take some other action your organization’s stakeholders care about?
“Surveys helped us understand that we haven’t made a strong enough pitch for why we cannot exist without readers and how dependent we are on readers to support our work. The survey confirms that we didn’t have the urgency in our messages that we needed. Because people were giving to other nonprofit news and not us, and yet saying they really appreciated our coverage.”
— Tracy Quattrocki, executive editor, Evanston Roundtable
3. Content and Product: These questions should feel the most familiar. Understanding where new products, like smart speakers, are adopted by different groups is very valuable over time. News categories can be trickier — two groups may mean very different things when they say health coverage is important to them. But we’ve provided questions with ways to drill down into complex topics, particularly how audiences would like to see crime covered.
- Find topic silos. Explore where there is sizable interest for a single topic or how the audience for one topic, politics, for example, is isolated from other constituencies.
- Lifestyle drives choices. Whether someone commutes by car to work in an office can strongly influence how they get the news, so it’s important to look into what may be driving product choices.
- Find who shares the news space. Learn who else your organization is in conversation with for different constituencies, both news organizations and beyond. You need to know where conversations are happening to be part of them.
“A shift is almost as good or better than achieving a comprehensive representational benchmark. If we can show that a new product or offering is substantially shifted from a baseline demographic along any axis — age, gender, race, or socioeconomic status — that shows that that product is executing our mission and moving the needle in some way.”
— Ariel Zych, director of audience, Science Friday
4. News Experience: The feelings people have while reading the news are often invisible, but are one of the largest drivers of their relationship with the organization, researchers have found. Using the right research-backed questions can help illuminate when there is a deeper bond and when there is room to strengthen the relationship. These questions are also a great starting point for analyzing survey responses.
- This is interesting. Knowing whether people talk about your stories in real life conversations is one of the best indicators of whether you’re accomplishing your foundational job — being interesting.
- This is for me. When people describe your organization as being for someone other than them or saying they don’t see themselves in the work, the organization needs to reassess.
- This is useful. Your audience chooses to return to your organization because it’s part of their life. Whether your organization is a vital part of readers’ news routines, a key source of information or fosters feelings of connection to their community, there is an underlying utility to identify and unpack.
“As an audience scholar, it’s critical to understand if you’re trying to make connections that aren’t just ‘women go to these stories. Men like these stories.’ There’s an underlying why — why are those stories performing better? Or why are people doing the things that they’re doing? And that gets you to a place that’s more proactive, more predictive.”
— Stephanie Edgerly, professor, Medill School of Journalism
5. Permissions: Often overlooked are a set of questions that open up your organization’s ability to use the survey responses more broadly. Ask respondents to provide an email, so you can connect to other data you have. But be upfront about how you will use the responses and then allow people to opt out now rather than seeking permission later.
- Bespoke panels. Your survey responses are the best way to find people within your audience for follow ups like focus groups or product testing.
- Spokespeople and ambassadors. A compelling note from a reader may be more convincing to a donor or funder, so allow your organization that option.
Distribution
Direct email solicitation is the most effective distribution strategy for most online surveys. Email is easy to manage and the options are cheap and plentiful. It only strengthens the value of existing email lists, which also tend to be the backbone for distributing news and soliciting donations. Surveys can be done much of the year, but avoid doing a general survey three weeks before or after a fundraising campaign and during heavy email periods over the winter holidays. Setting a deadline can help drive responses and is recommended.
Sample Survey Email
Subject: What do you want to see XXX do next?
We want to hear from you as XXX thinks about what’s working and what more we can do for our community. Your input will help XXX continue to [fulfill our mission].
[Take the Survey]
Every response is important to us here at XXX and as a thank you we will randomly select XX responses to get [a special gift].
Please, take a few minutes to take the survey — I’m looking forward to reading your responses.
Thank you!
NAME
TITLE
ORGANIZATION
Aim to get survey responses from 15 percent of the final email list. Most general surveys will go to the full master email list, but it’s important to ensure that the list is cleaned of duplicates and internally clearly marked with all lists that include that email.
Distribution can be supplemented with other options, but most come with more work for staff and are less effective, so should be used to fill specific gaps.
Including a link within an existing newsletter is an option, but response rates are frequently below 5 percent. Social media is also an option, but response rates can vary wildly and requires more experience to vet responses — some news organizations have had more than 90 percent of their responses from social media excluded from the final analysis.
Make a direct ask from a specific person within the organization. Tell the reader what’s in it for them — why you are conducting a survey, what you are going to do with their response and how their feedback will shape the organization and its work.
Consider offering incentives. Telling people you will give a free tote bag or $50 gift card to five randomly selected respondents can help improve response rates. Never include these incentives in social media solicitations as it invites bots and other bad responses.
Ask more than once. Previous news audience surveys have found that only a third of survey responses come from the first request. While response rates do typically drop by about half with each subsequent request, it is well within reason to ask three or more times over the course of 10 days. Using a deadline can help drive response — and extending a deadline if needed.
Tell people you read their responses. People like feeling heard and the survey process itself can strengthen your relationship with your audience. Carefully select some survey insights to share back with readers in a follow-up email.
“If you go out and ask your readers to tell you something, and then they never hear from you again, it hurts trust. And so what we did in follow up emails, like that, the newsletter transparently said ‘We just want to, acknowledge so many of you responded to our survey, we’re really grateful. So far, we’ve heard from 150 people, here are some top line trends that we noticed from your responses.’ When readers take time out of their busy day to tell us these things, they want to know, did you even read my thing, like, and we can’t respond to them all individually, but we can be very intentional about messaging. Broadly.”
— Nichole Dobo, Senior Editor for Audience Engagement, Innovation and Product, the Hechinger Report
Cleaning Your Data
INN’s template survey is designed to minimize the amount of data cleaning necessary to make it accurate and useful, but data cleaning is still an important step.
Much of the work is easy to do, but it’s helpful to familiarize yourself with the signs that more time needs to be spent on cleaning the data.
▶ Blanks or unexpected line breaks
▶ Cells with multiple values
▶ Columns with more than one kind of data (e.g., numbers and text)
▶ Text formatting that doesn’t look right
▶ Bot responses, indicated by repeated timestamps, verbatim copy+pasted responses or junk email addresses
The University of Illinois has provided an excellent and free resource, Data Cleaning for the Non-Data Scientist.
INN staff can also help clean your data, reach out to Sam Cholke, manager of distribution and audience growth, at sam@inn.org.
Analysis
Analysis can be the most intimidating portion of the survey process. One helpful starting point is to return to the departmental questions that helped design the survey in the first place.
A good survey will have several questions that are included to help with analysis. For example, a question that distinguishes between constituencies that are reading stories because it relates to their work and those who read for other reasons can be very useful. It can illuminate where one part of a person’s life, like their job, overcomes another that might otherwise discourage particular news habits, like their political identity.
Academic and marketing experts both strongly suggest waiting to look at responses based purely on demographics. Instead, search through your survey for questions that are divisive and have strong opinions at either end of the spectrum. Use a filter or tools like SurveyMonkey’s “Compare” option to examine how each end of the spectrum answered other questions. You’re searching for groups of 100 or more responses that have meaningfully distinct answers to questions about how your organization reports and distributes the news.
It is certainly OK to consider basic demographic characteristics as well and can be illuminating about product choices, but avoid letting it obscure otherwise meaningful constituencies. A good survey will allow people to show you the different parts of their life that are most active in their relationship with the organization.
“In CT Mirror’s first survey in 2018, we asked, ‘What state news issue interests you most?’ We included 10 prompts, including topics we covered and topics we did not cover. To our surprise, economic development, a topic we did not cover, was third highest in terms of reader interest. Based on this insight we raised funding for an economic development beat and launched it in 2021.”
– Bruce Putterman, CEO and Publisher, The CT Mirror
INN staff can also help analyze your survey responses, reach out to Sam Cholke, manager of distribution and audience growth, at sam@inn.org.
Clever Data Cuts
Compare new readers vs. old. Filter based on existing data about when people signed up for the newsletter and see how new readers may differ from early adopters.
The open door of big news events. Many people find news organizations during major news events that personally affect them. Look for those who signed up during such an event and how they may differ from your average reader.
Newsletters alone. Segment out those who say your only touchpoint with them is the newsletter or those who Mailchimp or other providers say are not consistent readers to understand how else they are staying connected.
Next Steps
Reporting out on a survey’s results is more than one meeting. One of the worst outcomes is a presentation on the results and a report that gets immediately shelved.
Start by outlining the constituencies and the differences the analysis found. Set a baseline for where there are strong touchpoints for the organization across constituencies.
Reiterate the questions each department said they were invested in and the actions they planned to take based on the responses. Speak directly to the options for action.
It is a unique moment where it becomes clear how all the departments’ work contributes towards the organization’s goals. Take time to draw this out. For example, a survey may help build the case that expanding the investigations team would motivate existing donors to give more, appeal to target audiences and also help with staff retention.
Surveys are a goldmine for marketing. Search for terms positively associated with the organization among those who are past or likely donors and think about incorporating them into fundraising appeals. Even better, look for open-ended questions where a donor uses language that may be convincing to others if incorporated into a fundraising campaign.
Carefully choose stats to share publicly with institutional funders or major donors. Choose only stats you are confident will consistently improve and you will want to continue sharing.
Identifying people you want to talk to more directly. Seeing a split among readers based on whether they commute? Send an email to just commuters to talk more. Finding seemingly very different groups with a strong interest in environmental news? Reach out to get more nuance on what they’re interested in.
Recognize your invisible audience. You constantly get feedback from your audience and should watch for obvious gaps, like people that speak up when a story about their area gets a detail wrong, but aren’t well represented in the survey. Consider what the responses say and how they can guide you to go out and fill those gaps with interviews, focus groups or other methods.
Conclusion
Quality surveys are well within the grasp of any news organization. INN is providing tested structure and question sets that will work for most news organizations to create a valuable annual survey, even if resources and staff time are limited.
INN provides assistance for member organizations at every step of the survey process because we know how much surveys can contribute to creating an impactful and sustainable organization.
Reach out to INN’s audience team to find out more about how we can help you get the most out of your annual survey.
Acknowledgments
The survey template and guide were created with contributions from dozens of INN member organizations, news audience researchers and others.
INN would like to thank the members who served on the Audience Advisory Board throughout the process of creating these resources.
Alejandra Armstrong, audience engagement editor, Cityside
Alejandra Armstrong amplifies the reporting of Cityside publications Berkeleyside and The Oaklandside and ensures they are connecting with all parts of the communities they serve and meeting audiences where they are. She has enjoyed working in different types of media but her passion is local news.
Ariel Zych, director of audience, Science Friday
Ariel Zych leads the engagement, learning, research, and impact strategies and activities at Science Friday, working to make science exciting, accessible, equitable, and representative to a growing national audience. She brings to her work a background in teaching and experience in working across platforms to investigate questions about news audience behavior.
Brian Hiatt, director of marketing and membership, Mother Jones
Brian Hiatt leads Mother Jones’ efforts to earn the support of online readers. He brings almost two decades of experience in digital strategy for leading nonprofit organizations.
Bruce Putterman, CEO and Publisher, Connecticut Mirror
Bruce Putterman leads the strategic direction of the Connecticut Mirror, revenue generation, product innovation, reader engagement, and all business operations. He brings to his work deep experience in audience and market research from 20 years in the marketing and advertising industry.
INN staff and the Audience Advisory Group was assisted in their work by a group of leading news audience researchers from around the world.
Stephanie Lynn Edgerly is a professor and associate dean of research at the Medill School of Journalism, Media, Integrated Marketing Communications at Northwestern University. She specializes in audience insight and is a leading researcher on how features of new media alter the way audiences consume news and impact engagement.
Jacob Nelson is an assistant professor of journalism at the University of Utah. He is the author of “Imagined Audiences: How Journalists Perceive and Pursue the Public,” co-founder of Engaged Journalism Exchange and researches the relationship between journalism and the public.
Tim Groot Kormelink is an assistant professor of journalism studies at Vrije Universiteit Amsterdam in the Netherlands. He is the co-author of “Changing News Use: Unchanged News Experiences?” and studies everyday news use, including how it impacts loyalty and willingness to pay for news.
* For more information on how to use other audience research tools in conjunction with a survey, visit the Nielson Norman Groups’ free reports, including selecting the appropriate research method.
** Reuters Institute found in 2022 that older white audiences are much more likely to prefer newsletters as a news product compared to other groups, https://reutersinstitute.politics.ox.ac.uk/digital-news-report/2022/email-news-its-contribution-to-engagement-and-monetisation