Executive Summary & Fast Facts
Executive Summary
The 2022 INN Index Report shows that the nonprofit news sector largely weathered the threats and disruption of the COVID-19 pandemic and continues a growth cycle of more than a decade.
Growth can be measured across a variety of indicators, including the numbers of INN members, total revenue, philanthropic revenue, staffing size and audience reach. Collectively, these measures describe a robust field, increasing in capacity and influence. Beyond individual organizations’ growth, growing coordination in reporting and networked content distribution expand the impact of this journalism beyond the size and number of newsrooms.
Going deeper, the Index shows that growth is differentiated. For example, gains in philanthropic support to nonprofit news is most densely concentrated among larger national and global organizations.
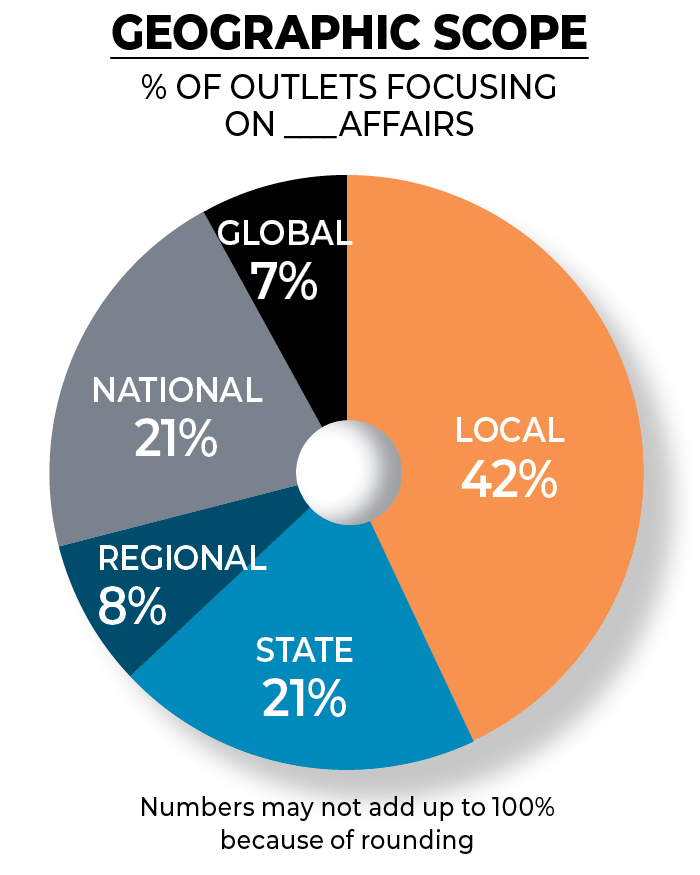
Smaller, local news organizations are driving growth in the number of nonprofit news outlets. Roughly 4 in 10 nonprofit news organizations are local, up from about 2 in 10 in 2017. Based on these trends, INN projects local outlets will make up the majority of nonprofit news organizations in 2024.
The Index also demonstrates challenges that could slow growth and merit attention in coming years. These include: the capacity to attract and retain diverse staffs, especially beyond a cluster of newsrooms primarily focused on serving communities of color; access to philanthropic support for smaller and emerging newsrooms; and the cultivation of market-based revenue where it is possible and aligns with the public service mission.
Are you new to nonprofit journalism? See our overview of nonprofit news and the INN Network, and INN’s member directory for a full list of INN members.
Fast Facts
Here’s what INN’s 2022 Index tells us about the state of the field.
- Most nonprofit news outlets are steadily growing their revenue. Two-thirds of news organizations grew total annual revenue over the four years from 2018 though 2021, and the median growth was 25%. Nearly 1 in 5 outlets saw their revenue decline from 2018 through the pandemic while about 15% held steady. Jump to the revenue section for details. This trend data comes from a cohort of 92 outlets of which 82 provided consistent revenue data for 2018 and 2021. Outlets reported consistently during this timeframe but we focus on the change from 2018 to 2021 as those two years generally reflect and quantify the overall trends. Throughout this report, you will find trend data from this group labeled as the “Index trend set.”
- The startup pace continues: Since 2017, more than 135 nonprofit news outlets have launched, roughly double the number of startups that launched in the previous five-year period.
- Local news is rapidly growing. Over half of the news outlets that have launched since 2017 – 55% – are local, and the growth of locals has increased year over year. In 2020, 57% of new launches were local, and in 2021, 65% of launches were local. Based on early 2022 membership data, we expect this trend to continue. Local news startups are moving into smaller markets, and the fastest growth is in the Southeast and Western U.S. regions. Jump to the local news section for more information.
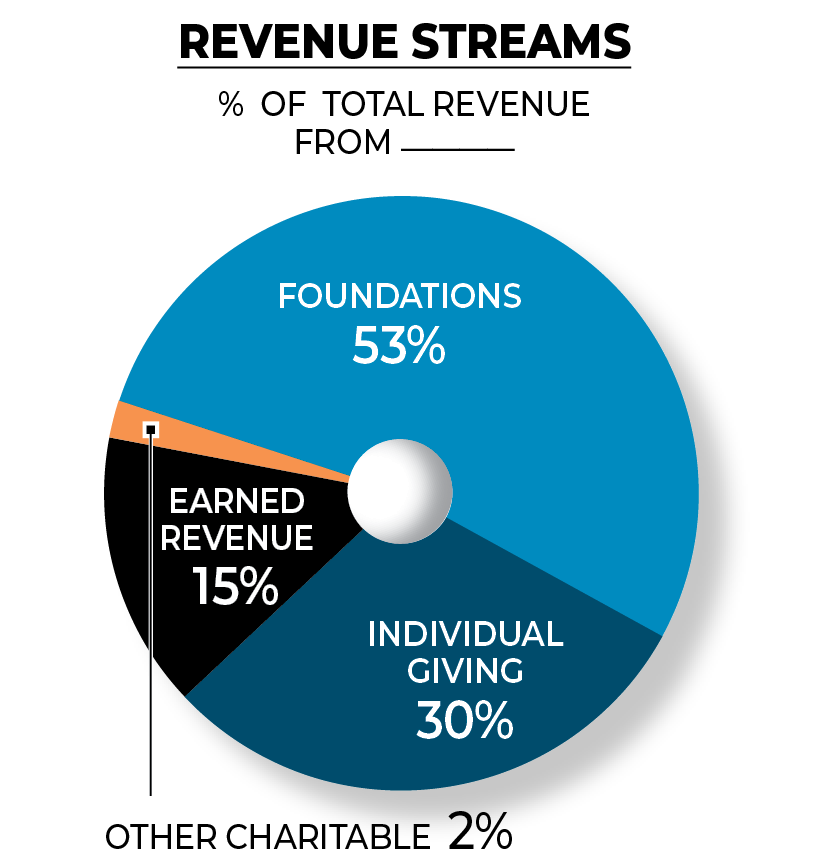
- Nonprofit news outlets bring in a median $373,000 in annual revenue and have a median of 6 FTEs on staff, consistent with previous years, but the median is increasingly “untypical” in that it is pulled from widening ranges of revenue, outlet type, audience and virtually every measure as the field diversifies. Total revenue ranges and revenue sources vary by the type of nonprofit news outlet. The median annual revenue for local news outlets, for example, is $245,000 with 40% of that from foundations, 29% from earned revenue and 28% from individual giving. National and global outlets bring in a median of $1.2 million annual revenue, with nearly 60% of their total revenue from foundations, 27% from individual giving and 12% from earned revenue. Jump to the revenue section for more information.
- Staff diversity stayed consistent but variable. Across the field, a little over half (53%) of staff are white and over a third (35%) are people of color. This more or less represents diversity levels from last year. Yet, racial and ethnic representation remains highly variable across the field. Outlets with a mission to primarily serve communities of color drive most of the field’s diversity gains. Jump to the staff diversity section for more information.
- Nonprofit news audiences grow over time. Two-thirds of the Index trend set grew web traffic from 2018 to 2021 (measured by average monthly uniques), with a median growth in web reach of 33% over this four-year timeframe. Today across the nonprofit sector, more than 7,100 outlets regularly published or aired INN member work in 2021. Jump to the audience data section for more information.
RELATED INN Network Directory