Race & Ethnicity Composition
What is the racial and ethnic composition of nonprofit news outlets?
The racial and ethnic composition of nonprofit news personnel is largely similar to the U.S. population.
According to the U.S. Census Bureau, people who identify as “white alone, not Hispanic or Latino” comprise about 58.9% of the U.S. population.5 Among INN members, 55.3% of personnel identify as white (and no other racial or ethnic category), a slightly lower percentage than the population overall (Figure 1).6 Black or African American individuals comprise 12.2% of nonprofit news personnel, compared to 13.6% in the U.S. population, while Asian individuals make up 6.8% of nonprofit news personnel and 6.3% of the broader population. Approximately 1.1% of nonprofit news personnel identify as Native American, Indigenous or Alaska Native, compared to 1.3% in the general population, and Native Hawaiian and Other Pacific Islander individuals comprise 0.4% of news personnel, compared to 0.3% in the general population.7
Hispanic and Latino/a/x individuals stand out as the primary divergence: they make up 10.5% of nonprofit news personnel, compared to 19.1% of the U.S. population. Although this suggests that people who identify as Hispanic or Latino/a/x are underrepresented in nonprofit news outlets, it is important to be cautious in making comparisons because of differences in how Hispanic or Latino origin is measured in the census versus INN’s 2023 Index.8
The nonprofit news workforce is more racially and ethnically diverse than many news industry peers.
Approximately 35.7% of nonprofit news personnel are BIPOC. (This is an extrapolated category that we have defined, for the purposes of this report, as encompassing individuals who identify with a racial or ethnic category other than white, including multiracial.) Although comparisons with the rest of the news industry are complicated due to a lack of comprehensive, comparable data on workforce diversity,9 available data tentatively suggest that nonprofit news organizations are relatively more diverse than many of their peers. For example, based on data from RTDNA’s 2022 survey of broadcast news outlets, BIPOC people made up a smaller proportion of the TV news workforce (25.5%) and the radio news workforce (17.8%), compared to nonprofit news organizations.10 RTDNA data further show that the non-commercial radio news workforce is more diverse than its commercial counterpart. That aligns with the higher level of diversity reported by National Public Radio (41% BIPOC).11 Although we lack comparable aggregated data for newspapers and digital news outlets, recent data shared by individual news organizations indicate that INN members are more diverse than Gannett (25% BIPOC), and roughly comparable to the New York Times (37% BIPOC) and the Washington Post (39.6% BIPOC).12
Comparisons with the nonprofit sector and the U.S. workforce more broadly are complicated due to differences in how race and ethnicity are reported. The U.S. Bureau of Labor Statistics reports that 77% of the U.S. workforce was white in 2022, and Independent Sector reported that the nonprofit sector workforce was 76% white in 2022 — both of which are significantly higher than the percentage of white nonprofit news personnel (55.3%).13 However, both of these metrics include white people who identify as Hispanic or Latino; they do not provide a “white alone, not Hispanic or Latino” category, which would be more comparable INN’s data.14
There is less diversity at leadership levels of the nonprofit news sector.
When we break down the broader category of personnel into component parts, we observe different levels of diversity among staff and contractors compared to those in leadership positions (Figure 2). Among organizations’ top three executives, 68.8% are white and 28.2% are BIPOC. By comparison, 52.6% of non-managerial staff and contractors are white and 36.7% are BIPOC.
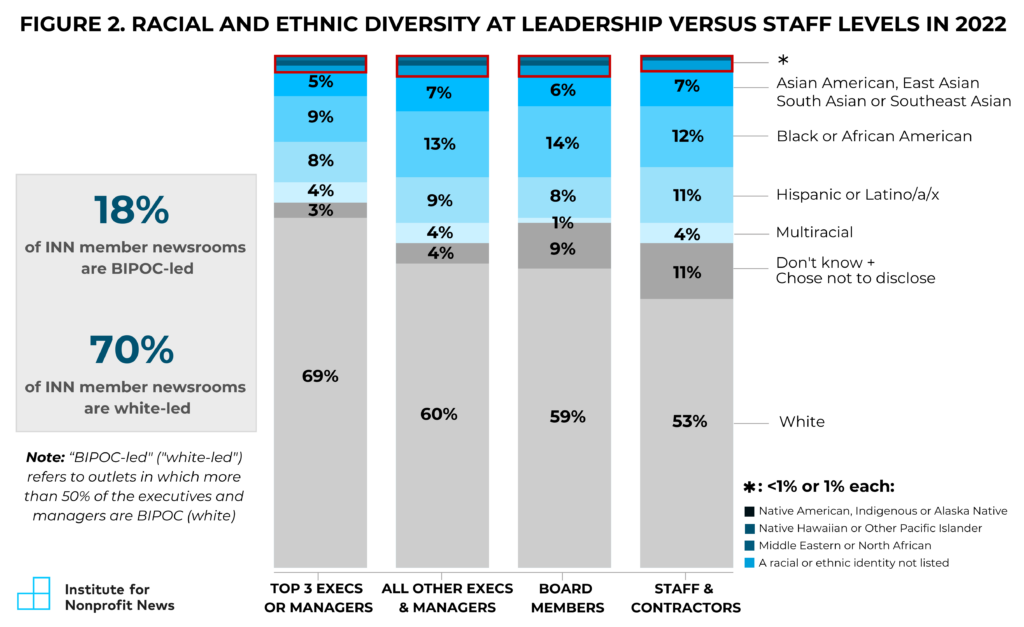
A corresponding pattern emerges when we look at how many nonprofit news organizations have leadership that is majority-white versus majority-BIPOC. More than two-thirds of outlets (70.2%) are white-led, which we define as organizations in which more than 50% of all executives and managers are white. This is about four times the number of nonprofit news organizations that are BIPOC-led (17.5%).
Defining “BIPOC-led” and “BIPOC-serving”
There are varying definitions of “BIPOC-led” used throughout the news industry, the nonprofit sector and philanthropy. Some definitions focus on the CEO or the founder; others include top executives and board members. Still others consider multiple levels of leadership and whether the organization serves BIPOC communities.
For purposes of this report, we have defined “BIPOC-led” as organizations in which more than 50% of all executives and managers identify with a racial or ethnic category other than white, including multiracial.
We have defined “BIPOC-serving” separately, based on whether newsrooms indicated that they focus primarily on serving the information needs of communities of color. We provided a specific definition of “focus primarily” for survey respondents: “people of color comprise a majority of your audience and your organization spends a majority of its funding, resources and staff time on stories for people of color.” We relied on organizations self-identifying if their audience and operations align with this definition.
In this report, we are careful to specify when we are referencing “BIPOC-led” versus “BIPOC-serving” metrics – or, where relevant, if both terms apply.
Outlets at the state or province level are the least likely to have BIPOC-majority leadership: 10.1% of these outlets are BIPOC-led, while 82.8% are white-led. National outlets emerged as the most likely to be BIPOC-led (24.6% of these outlets have BIPOC-majority leadership), while outlets at the local, regional and global level fell in between.
Although we don’t have directly comparable data, a similar pattern is observed among news industry peers. For example, RTDNA’s 2022 survey, cited above, shows that white people comprise a higher proportion of TV and radio news directors, compared to their proportion in the broader TV and radio news workforce. Gannett and other major news organizations like The New York Times and The Washington Post also report this same pattern: The proportion of white people is higher at leadership levels, compared to their broader pool of employees.15
BIPOC personnel are not evenly distributed across all news outlets; many are concentrated in outlets where they comprise the majority of people in the organization.
Looking at the racial and ethnic composition within each news organization, we observe that approximately 23% of INN members are majority-BIPOC outlets – that is, more than half of their personnel are BIPOC. This set of outlets accounts for nearly half (46%) of all BIPOC personnel working for INN members.
At the other end of the spectrum, a larger set of outlets (about 55% of INN members) reported that BIPOC individuals make up less than a third of their personnel. About 23% of all BIPOC personnel work for these outlets. These patterns speak to the varying levels of diversity that staff and leaders experience in their respective working environments.
Has racial and ethnic diversity among nonprofit news outlets increased over time?
This question has long challenged the news industry as a whole. Efforts to track diversity in the industry, led by the American Society of News Editors (now National Leaders Association) since 1978, suggest that news organizations remained short of reaching racial and ethnic parity with the U.S. population as of its latest survey in 2018.16 More recently, there is heightened awareness around the imperative to measure changes in diversity after the 2020 racial justice protests prompted many news outlets to undertake DEI efforts.
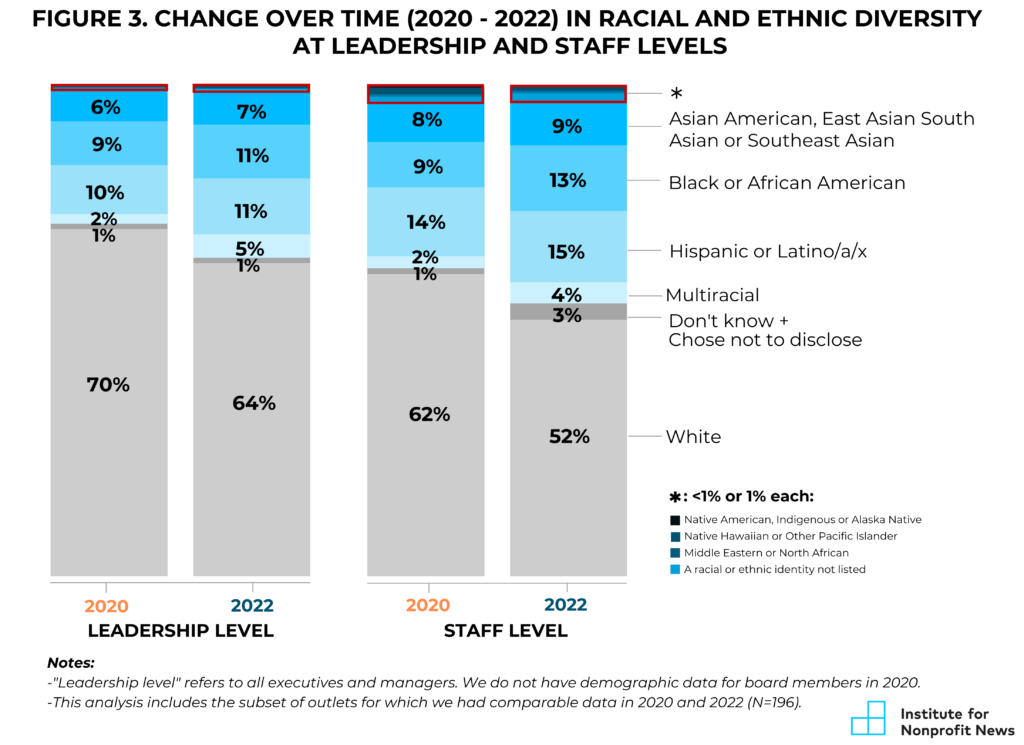
The data show that the racial and ethnic composition of INN’s membership did become more diverse overall between 2020 and 2022 (Figure 3).
Pooling data across outlets, we observed a 7 percentage-point increase in BIPOC personnel during this two-year period – both at the staff and contractor level (rising from 37% to 44% BIPOC) and at the executive and manager level (rising from 28% to 35% BIPOC). As noted earlier, this analysis focuses on outlets for which we have comparable data across the two years, ensuring that observed changes are not attributable to changes in INN’s membership.
This increase in diversity among nonprofit news outlets is larger than changes observed in RTDNA’s trend data on broadcast outlets: The percentage of BIPOC people in the workforce grew by 2.4 percentage points for radio news and 0.5 percentage points for non-Hispanic TV news between 2020 and 2022.17 Digiday’s trend analysis of the percentage of white employees at major media organizations suggests the amount of change varies, but most organizations report an increase in diversity of between 2 and 5 percentage points.18
But progress towards greater diversity was uneven across individual news outlets, particularly at the leadership level.
A little more than a quarter (28%) of outlets reported an increase in BIPOC representation among executives and managers, while the remaining outlets either stayed the same or reported a decrease in the percentage of leaders who are BIPOC (Figure 4). This variation in the direction of internal change helps explain why we observed a very small increase in the number of BIPOC-led outlets overall.19 A shift towards more diverse leadership within a minority of outlets did not yield a substantial change in the overall number of outlets led by people of color.
To explore change among majority-white outlets in particular, we narrowed our focus to the subset of outlets whose personnel were more than 50% white in 2020. These outlets comprised a large majority (77%) of the news organizations for whom we had comparable data. The same pattern emerged, with 28% of these majority-white outlets reporting an increase in BIPOC leadership in 2022.
Large outlets were particularly likely to report changes towards greater BIPOC representation at the leadership level, compared to smaller and mid-sized outlets.20 Nearly 3 in 5 large outlets (59%) reported an increase in the percentage of BIPOC executives and managers between 2020 and 2022.
Movement towards greater diversity at the staff level was more widespread: 51% of all outlets reported an increase in BIPOC representation among their staff and contractors. Among the subset of outlets with majority-white personnel in 2020, the proportion of outlets reporting an increase in staff diversity was slightly higher at 57%. Again, large outlets were particularly likely to exhibit an increase in diversity: Two-thirds of these outlets reported a higher proportion of BIPOC staff in 2022 compared to 2020. National outlets also stood out as particularly likely to report increased staff diversity (63% of them did so), compared to outlets with other geographic scopes.
5. See U.S. Census Bureau, Quick Facts, https://www.census.gov/quickfacts/ (accessed August 2023).
6. For purposes of this report, the term “personnel” refers to the combined number of executives, managers, staff and significant contractors reported by INN members. It does not include board members. “Significant contractors” were defined for survey respondents as “personnel who play a significant, ongoing role in your organization, not occasional freelancers or one-off projects.”
7. The remaining 9% of news personnel is composed of individuals whose race and ethnicity were reported as not known or not disclosed.
8. The U.S. Census asks two separate questions, one focused on ethnicity (Hispanic and Latino origin) and one focused on race. INN opted to ask one question that combines race and ethnicity, including “Hispanic or Latino/a/x” as a category alongside racial categories. We did this to align with our understanding of how most new outlets gather information about race and ethnicity, with the expectation that this would help them more easily determine how to respond accurately to our survey question based on the demographic information they have. We interpret the percentage of individuals who identified only as “white” in INN’s race/ethnicity question as roughly comparable to the U.S. Census’ calculated percentage of respondents who indicated only “white” in the race question and “not Hispanic or Latino” in the ethnicity question (i.e., “white alone, not Hispanic or Latino”). But we caution against treating the two metrics as the same, given the methodological differences.
9. See Sarah Scire, “Crushing resistance”: Yet again, newsrooms aren’t showing up to the industry’s largest diversity survey,” Neiman Lab April 12, 2022.
10. Bob Papper with Keren Henderson, “TV News Gets More Diverse, Still Doesn’t Reflect Public” (Radio Television Digital News Association/Newhouse School at Syracuse University, 2022). Bob Papper with Keren Henderson, “Radio Newsrooms Are More Diverse Than Ever” (Radio Television Digital News Association/Newhouse School at Syracuse University, 2022).
11. National Public Radio, “Staff Diversity Statistics and Breakdown - 2022” (accessed August 2023).
12. Gannett, “Workforce Diversity: Representation Trends 2020 – 2023” (accessed August 2023). The New York Times, “2022 New York Times Diversity and Inclusion Report.” The Washington Post, “The Washington Post’s Workforce Demographics” July 28, 2022.
13. U.S. Bureau of Labor Statistics, “Labor Force Statistics from the Current Population Survey” (accessed August 2023). Independent Sector, “Health of the U.S. Nonprofit Sector: A Quarterly Review,” Dec. 31 2022.
14. Based on additional data about the Hispanic/Latino workforce from the Bureau of Labor Statistics, we can generate a rough estimate for the proportion of the U.S. workforce that is non-Hispanic white (60.5%). But as noted in footnote 8, we caution against making direct comparisons between these data and INN data because of methodological differences in how race and ethnicity are measured. See U.S. Bureau of Labor Statistics, “BLS Report: Labor force characteristics by race and ethnicity, 2021” Report 1100, January 2023.
15. Gannett, The New York Times and The Washington Post posted demographic data for all personnel as well as breaking out the demographics of leadership separately. See Gannett, “Workforce Diversity: Representation Trends 2020 – 2023” (accessed August 2023). The New York Times, “2022 New York Times Diversity and Inclusion Report.” The Washington Post, “The Washington Post’s Workforce Demographics” July 28, 2022.
16. American Society of News Editors, “How Diverse Are US Newsrooms?” (interactive website with Google News Lab, accessed August 2023). See also News Leaders Association, “Digital-only platforms drive race and gender inclusion among newsrooms in 2019 ASNE Newsroom Diversity Survey” Sept. 10, 2019.
17. RTDNA data show that BIPOC workforce representation for all TV news outlets (Hispanic and non-Hispanic) actually fell by 1.1 percentage points between 2020 and 2020, but this appears to be a methodological artifact due to a drop in survey participation among Hispanic stations in 2022. Hence, we focus on non-Hispanic TV stations here. See Bob Papper with Keren Henderson, “TV News Gets More Diverse, Still Doesn’t Reflect Public” (Radio Television Digital News Association/Newhouse School at Syracuse University, 2022). Bob Papper, “Research: Local news diversity reaches records, but representation gap shrinks slowly” (Radio Television Digital News Association/Newhouse School at Syracuse University, 2021). Bob Papper with Keren Henderson, “Radio Newsrooms Are More Diverse Than Ever” (Radio Television Digital News Association/Newhouse School at Syracuse University, 2022).
18. Sara Guagione, “Media businesses are slowly getting less white, male-dominated, stats from Condé, WSJ, NYT, others show,” Digiday Jan. 5, 2023.
19. Within this set of outlets for which we have comparable data across the two years, the number of BIPOC-led outlets rose from 28 in 2020 to 31 in 2022.
20. For purposes of analysis, we grouped news outlets into four categories of organization size: very small = 1-5 personnel (26% of news outlets); small = 6-10 personnel (27%); mid-sized = 11-20 personnel (22%); and large = 21 or more personnel (25%).