Revenue & Expenses
Sector expands as resources and capital grow
Growth of the nonprofit news sector can be measured across a variety of indicators, including the numbers of INN members, total revenue, philanthropic revenue, staffing size and audience reach. Collectively, these measures indicate the field is robust, increasing in capacity and influence.
Some observers have wondered whether capital support would increase to match the needs of a growing nonprofit news sector. This year’s revenue estimates suggest that as the nonprofit journalism field expands, the resources to sustain this field increase too.
INN membership saw 11% growth in the number of (mostly) digital news outlets between 2022 and 2023. That growth did not translate into more competition over a static or shrinking pool of resources. Fieldwide revenue for these INN members grew about 22% in the same period, totaling just under $600 million.
About three-quarters of the outlets surveyed either grew total revenue or maintained revenue over a one-year period (from 2022 to 2023). The growth isn’t confined to INN’s larger, more established members. The largest organizations (by revenue amount) showed weaker growth in that time than smaller organizations. The reasons for this are likely multifaceted, tied to broader trends in philanthropy and underwriting, but it does appear that — at least among big-budget organizations — gravity may be asserting its pull. Otherwise, outlets in both the growth and decline categories are generally representative of the field as a whole with a mix of local, state and national or global outlets.
A note on public broadcasting: About two dozen public broadcasters are part of the INN Network. The figures in this report do not include data from those members because their organizational structures make it difficult to estimate both the amount of revenue tied to their news operations and the size of their newsroom staff. If they were added to these figures, total revenue across INN’s membership would be between $700 million - $900 million.
Latest revenue trends indicate fieldwide stability
The survey data indicate that nonprofit news revenue growth, which had been on the rise in recent years, held steady in 2023. Median revenue per outlet — about $477,000 in 2023 — is almost identical to the 2022 figure.
From 2021 to 2022, median revenue per outlet jumped from $373,000 to $477,000. State and regional outlets drove this gain, growing their median revenue by 36%. One major driver: foundations investing in larger, more established state and regional outlets. Survey data don’t explain why foundation support to state and regional newsrooms grew during this timeframe, but INN’s reporting indicated a shift in philanthropic attention to statehouse coverage.
On local news specifically, just over half of the 125 local outlets surveyed in 2022 and 2023 increased total revenue during this timeframe. Across all three major revenue streams — foundation funding, individual giving, and earned revenue — more local outlets experienced annual gains than declines. What characterizes the local outlets that experienced revenue growth? They are slightly younger on average than the local outlets in the trend set overall, and are much smaller in terms of annual revenue. Local outlets that saw declines tend to have bigger budgets than the local outlets overall in the trend set. They are no different in terms of median age compared to the local trend set overall.
Individual Giving
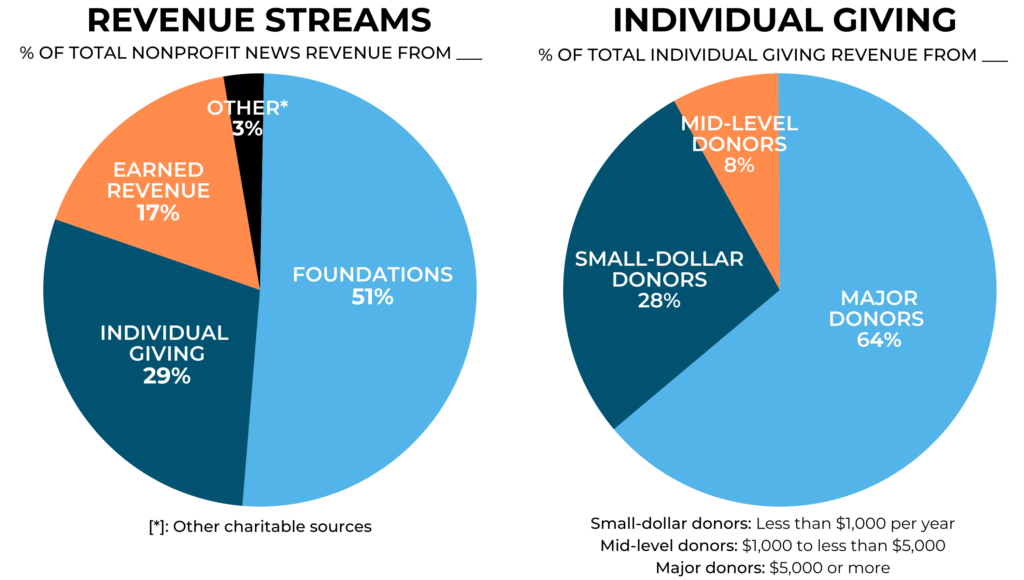
Since INN first started tracking the industry in 2017, individual giving has remained a steady revenue source to nonprofit news, making up about a third of total earnings.
Individual giving encompasses financial contributions from individuals, including major donors (gifts of $5,000 or more), mid-range donors ($1,000 to $5,000), and small-dollar donors (less than $1,000). The majority of individual donations come from major donors (64%), followed by small-dollar contributors (28%) and mid-range donors (8%).
Most recently, about half of outlets in the sample grew individual giving from 2022 to 2023, with a fifth (19%) holding steady and about a third experiencing declines. The outlets growing and losing dollars from individuals track with the wider nonprofit news field on the whole. For instance, 50% of local outlets and big-budget organizations increased their major donor revenue as did the field overall. One variable stands out: Organizations that primarily serve communities of color are less likely than other outlets to have grown their donor giving in the last year. Take small dollar donor giving, for example: Only about a third of the outlets primarily serving communities of color grew revenue from small-dollar donors from 2022 to 2023, whereas about half of all other outlets did. A similar trend holds for other types of individual giving.
Jump to INN’s 2023 Diversity, Equity and Inclusion Report for more on revenue trends with an equity lens.
Previous Index reports have shown individual giving to be a relatively stable revenue stream for nonprofit news, especially during the coronavirus pandemic years. Total individual giving to the Index trend set (the cohort of outlets that completed the Index survey for both of the previous two years) grew 53% over a four-year period, from more than $31 million in 2018 to more than $48 million in 2021, with a median increase of $37,000 per outlet. All types of outlets reported individual giving growth over the four-year period, with about 7 in 10 local, state or regional, and national or global outlets in the Index trend set reporting gains. Rising numbers of donors to nonprofit organizations drove up individual giving revenue during this time rather than increases in median gift amounts, which largely held steady year over year.
INN members can access individual giving benchmarking data through the Pods program.
One driver of individual donations is NewsMatch, the largest grassroots fundraising campaign to support nonprofit news in the U.S. News outlets use NewsMatch to incentivize individual giving and local funder contributions. In 2023, news outlets leveraged $6 million in program funding from national funders to generate more than $47 million from individual donors and $6.1 million in additional match funds from local foundations, businesses and major donors. The number of local match funders has more than doubled since 2020.
Earned Revenue
Earned revenue, including dollars from advertising, underwriting and sponsorship, is perhaps the most underutilized revenue stream for nonprofit news. Encouragingly, earned revenue now makes up 17% of revenue to nonprofit news, representing modest growth from 10% in 2017.
Earned revenue, especially advertising, appears to be back at pre-pandemic levels. For 2023, median revenue from earned revenue totaled $20,000 — more than double where it was in CY 2020 ($12,000).
Almost all (more than 80%) of advertising and sponsorship sales in nonprofit outlets are direct sales, as opposed to programmatic or ads sold by another organization. Direct sales require more staff time to market, sell and place than programmatic or ads sold by other entities but benefit outlets’ ability to set their own price and control the quality of the ad.
INN previously reported that local outlets in particular are regaining some of the advertising and other earned revenue dollars lost during the pandemic. Local outlets grew earned revenue significantly between 2021 and 2022, from $11 million to more than $15 million, a gain of 37% among the 52 outlets that reported earned revenue in that timeframe. Larger, more established local outlets are experiencing the most success regaining earned revenue, with advertising dollars (as opposed to sponsorship and underwriting) largely driving the growth.
Explore INN’s Guide on Earned Revenue for more on how nonprofit news outlets can build advertising, underwriting and sponsorship dollars.
Foundation Funding
Foundation funding makes up about half of all revenue to nonprofit news, a trend that has held steady year over year.
In 2023, more than half of grants going to nonprofit news outlets were from national or global foundations as opposed to local, community or statewide funders.
For most news outlets, a majority of their grant funding was available for general operating expenses instead of funding tied to specific projects or initiatives. More than half (53%) of outlets reported that 75% or more of their foundation funding was available for general operating expenses, a jump from 46% of outlets reporting the same the previous year.
Local outlets continue to see fewer foundation dollars compared to outlets that operate on a national or global scale. Local outlets employ 28% of full-time equivalents across the sector, but receive only 20% of foundation funding dollars. National and global outlets employ 45% of the sector’s FTEs and receive 57% of the sector's total foundation funding.
Foundation funding patterns are influenced by the geographic scope and missions of outlets. Jump to INN’s 2023 Diversity, Equity and Inclusion Report for more on foundation funding trends with an equity lens.
Expenses
Nonprofit news outlets expenses stayed relatively consistent year over year, with the majority of funds (62%) invested in editorial work and smaller amounts invested into revenue generation (14%), technology (7%) and general administration (17%) in 2023.
One promising trend: Spending on revenue generation is slowly increasing, from 10% of fieldwide expenses seven years ago to 14% last year.
Unsurprisingly, larger and more established organizations are more likely than their peers to spend more on revenue generation. That investment seems to pay off, although it’s a bit of a chicken or egg scenario: Outlets that spend 20% or more of their total budget on revenue generation report a total median revenue of $640,000, while outlets that spend 4% or less of their budget on revenue generation bring in about $152,000 in revenue.
One might expect that those larger organizations to be more reliant on foundation funding, but that’s not the case. Those outlets with a higher spend on revenue generation report only 29% of total budgets coming from grants, suggesting that as an organization matures, it is able to invest in building revenue from individual giving and earned revenue.
Explore INN’s case study series about how four statewide nonprofit news outlets diversify revenue over time:
- How Honolulu Civil Beat used the 'runway' from a billionaire’s investment in news to develop a diversified fundraising strategy
- How Mississippi Free Press’ pandemic launch reached a loyal donor base | Institute for Nonprofit News
- How WyoFile accelerated growth with community buy-in and grant funding | Institute for Nonprofit News
- How Bridge Michigan's focus on community engagement led to new member revenue | Institute for Nonprofit News